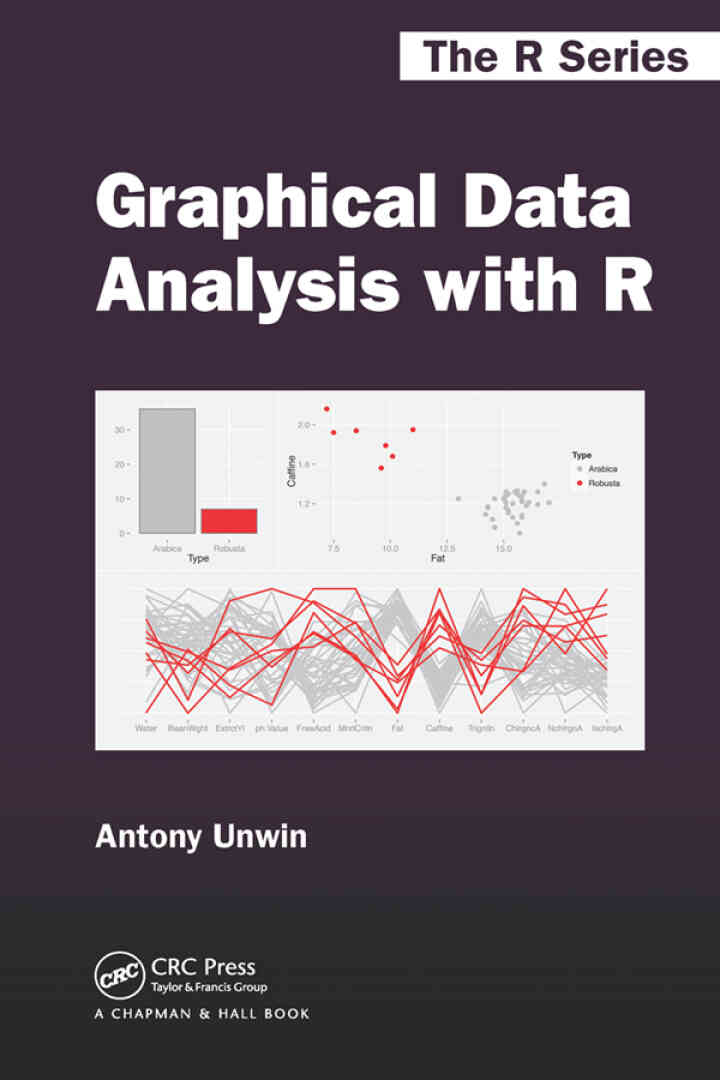
Graphical Data Analysis with R 1st Edition
$17.50
See How Graphics Reveal Information Graphical Data Analysis with R shows you what information you can gain from graphical displays. The book focuses on why you draw graphics to display data and which graphics to draw (and uses R to do so). All the datasets are available in R or one of its packages and the R code is available at rosuda.org/GDA. Graphical data analysis is useful for data cleaning, exploring data structure, detecting outliers and unusual groups, identifying trends and clusters, spotting local patterns, evaluating modelling output, and presenting results. This book guides you in choosing graphics and understanding what information you can glean from them. It can be used as a primary text in a graphical data analysis course or as a supplement in a statistics course. Colour graphics are used throughout.Graphical Data Analysis with R 1st Edition is written by Antony Unwin and published by CRC Press. ISBNs for Graphical Data Analysis with R are 9781315360041, 1315360047 and the print ISBNs are 9781032477312, 1032477318. Additional ISBNs include 9781498715232, 9781498715249, 9781315370088, 9781498786775, 9781315362298, 9780367364731.
Be the first to review “Graphical Data Analysis with R 1st Edition”
Related products


Best Seller


Reviews
There are no reviews yet.